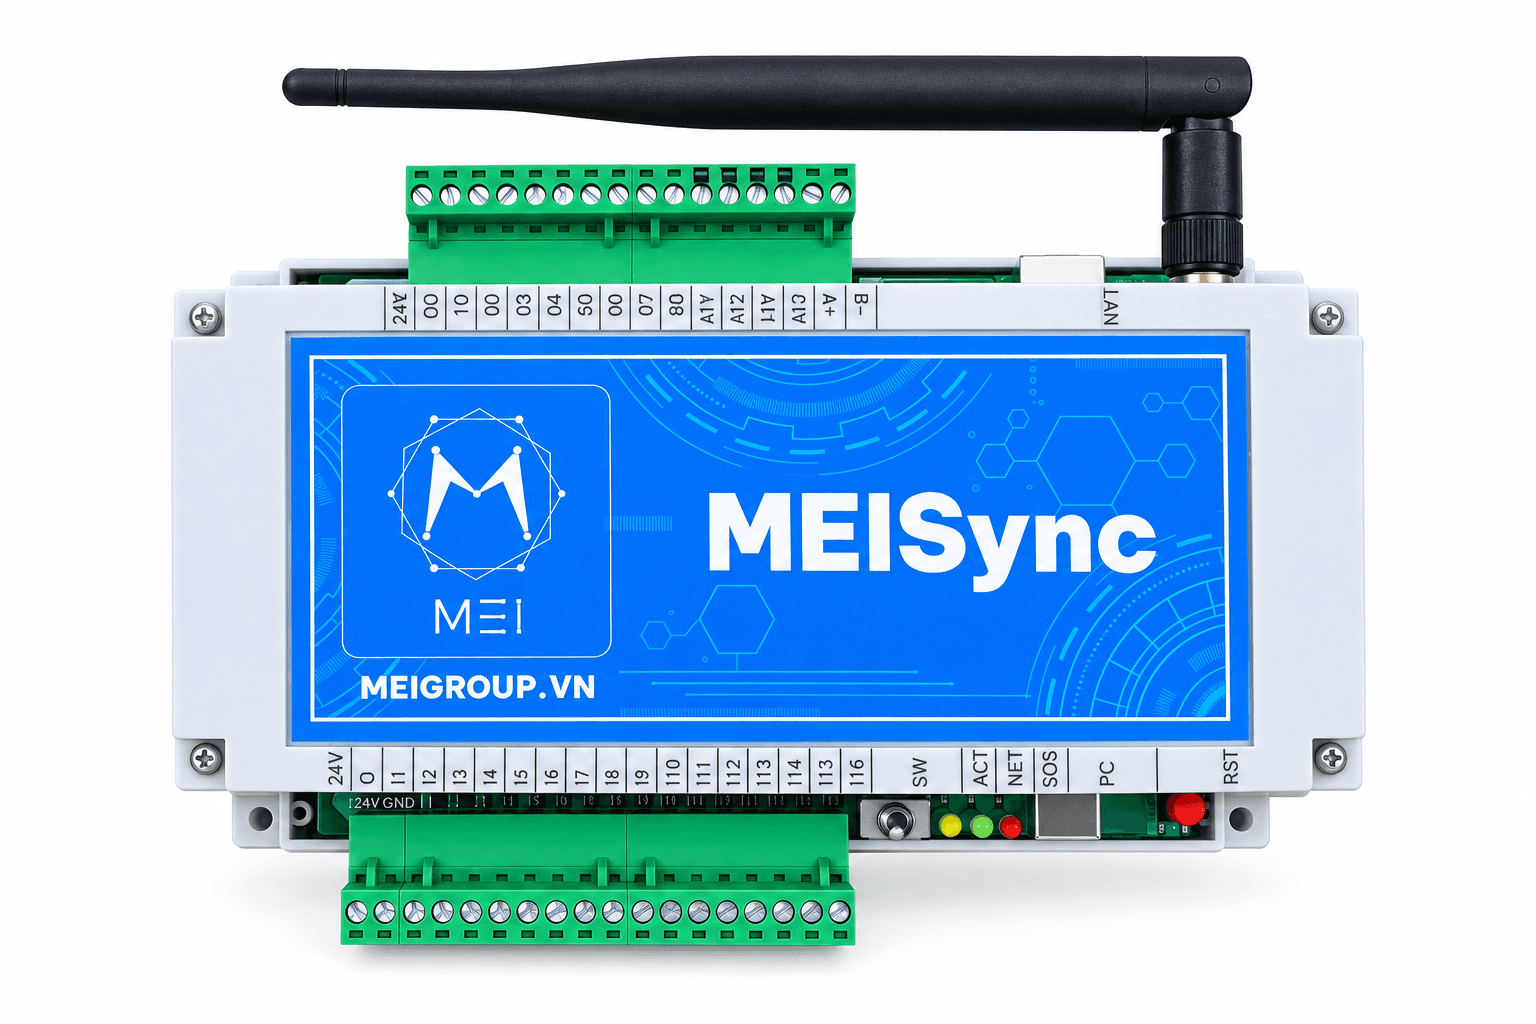
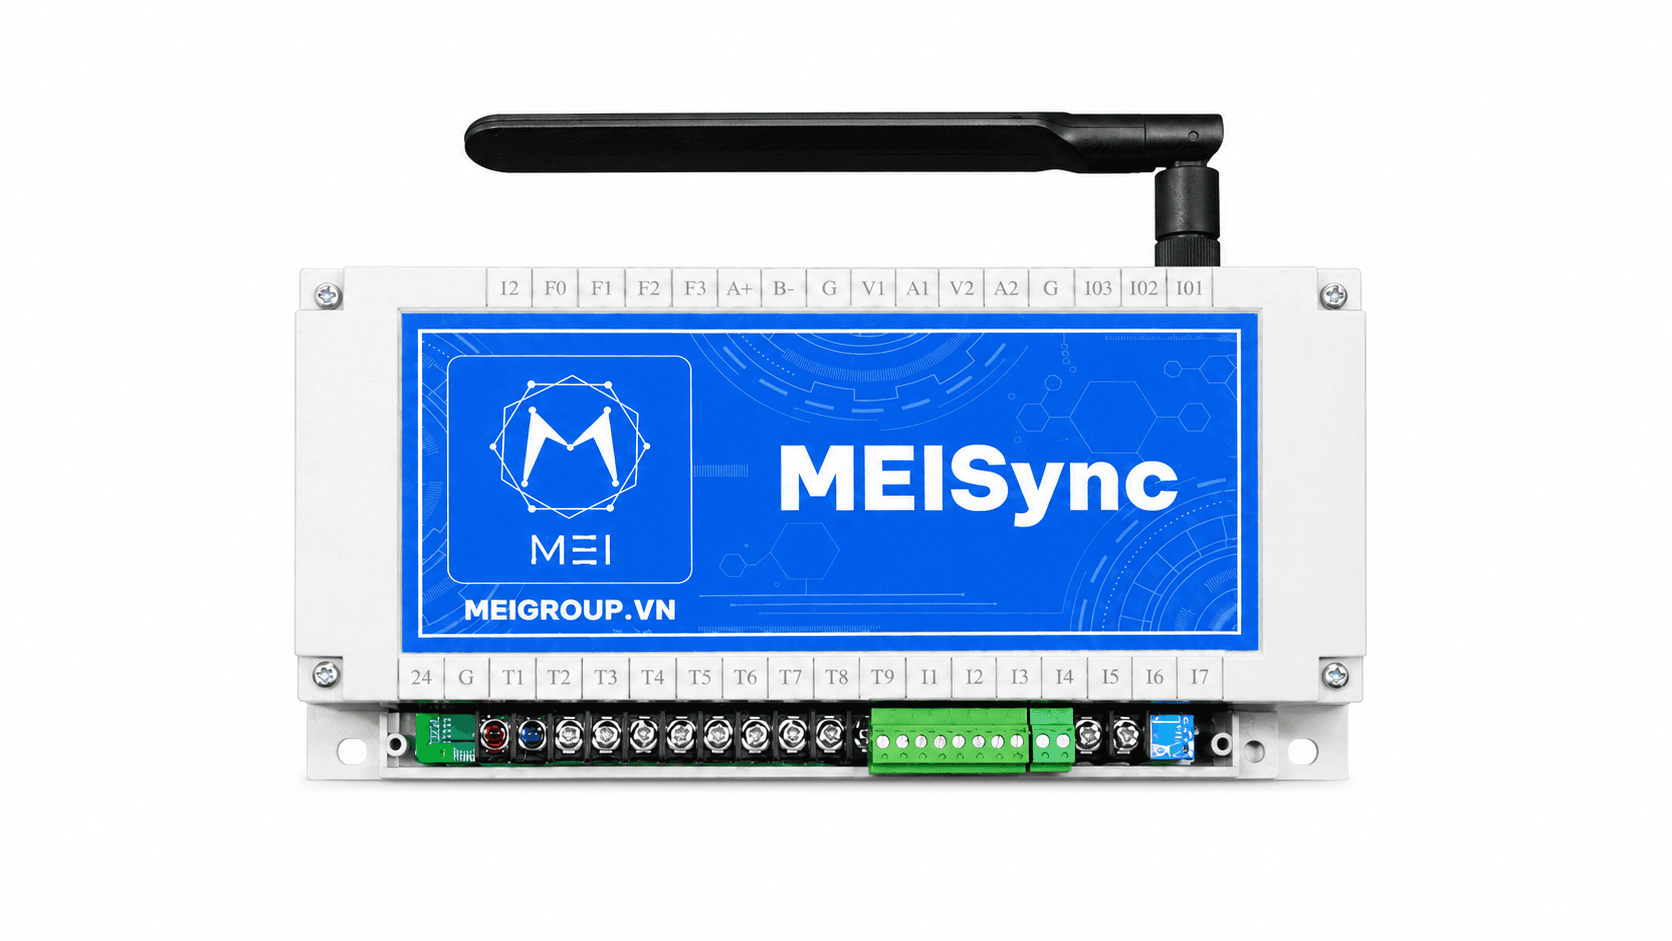
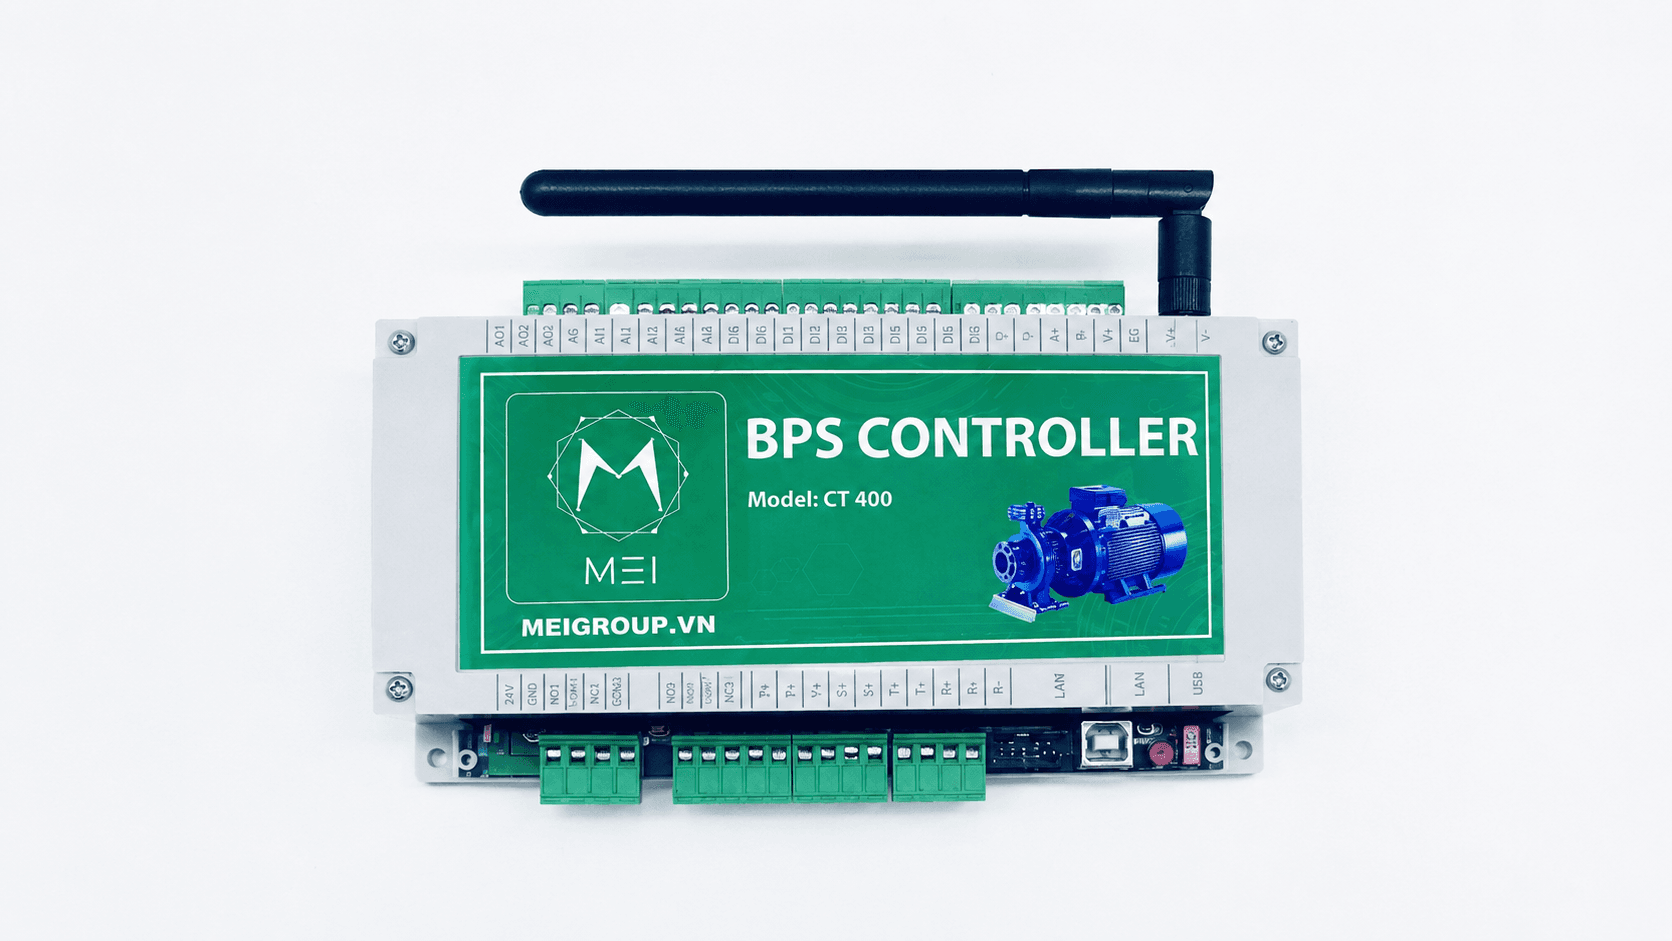
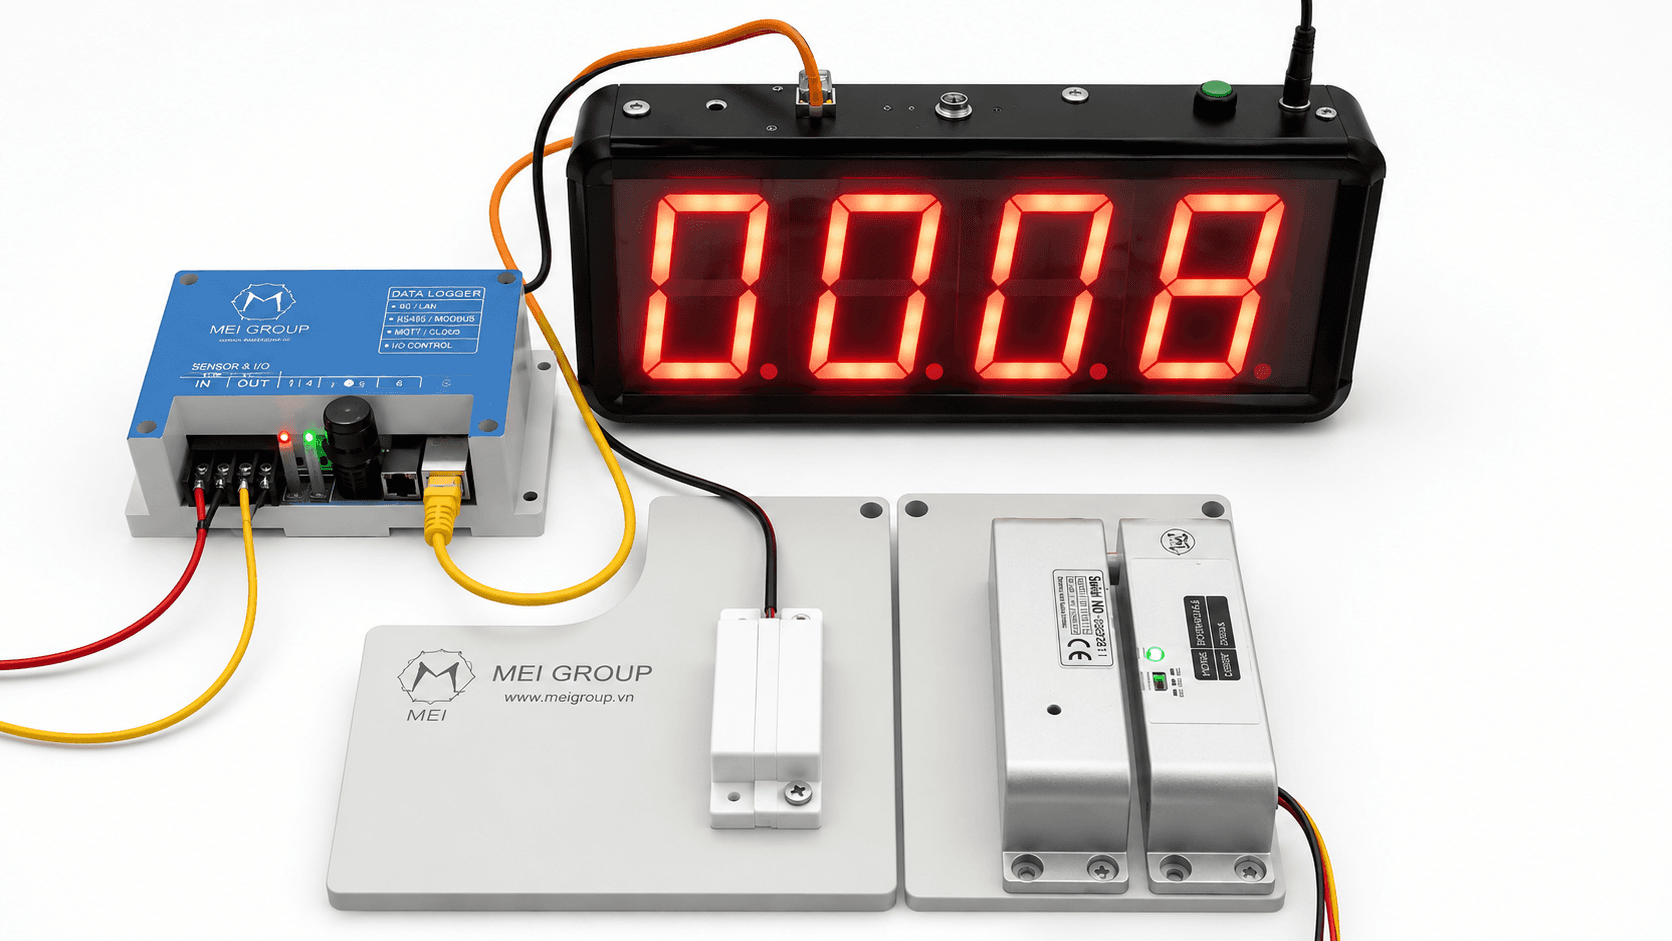
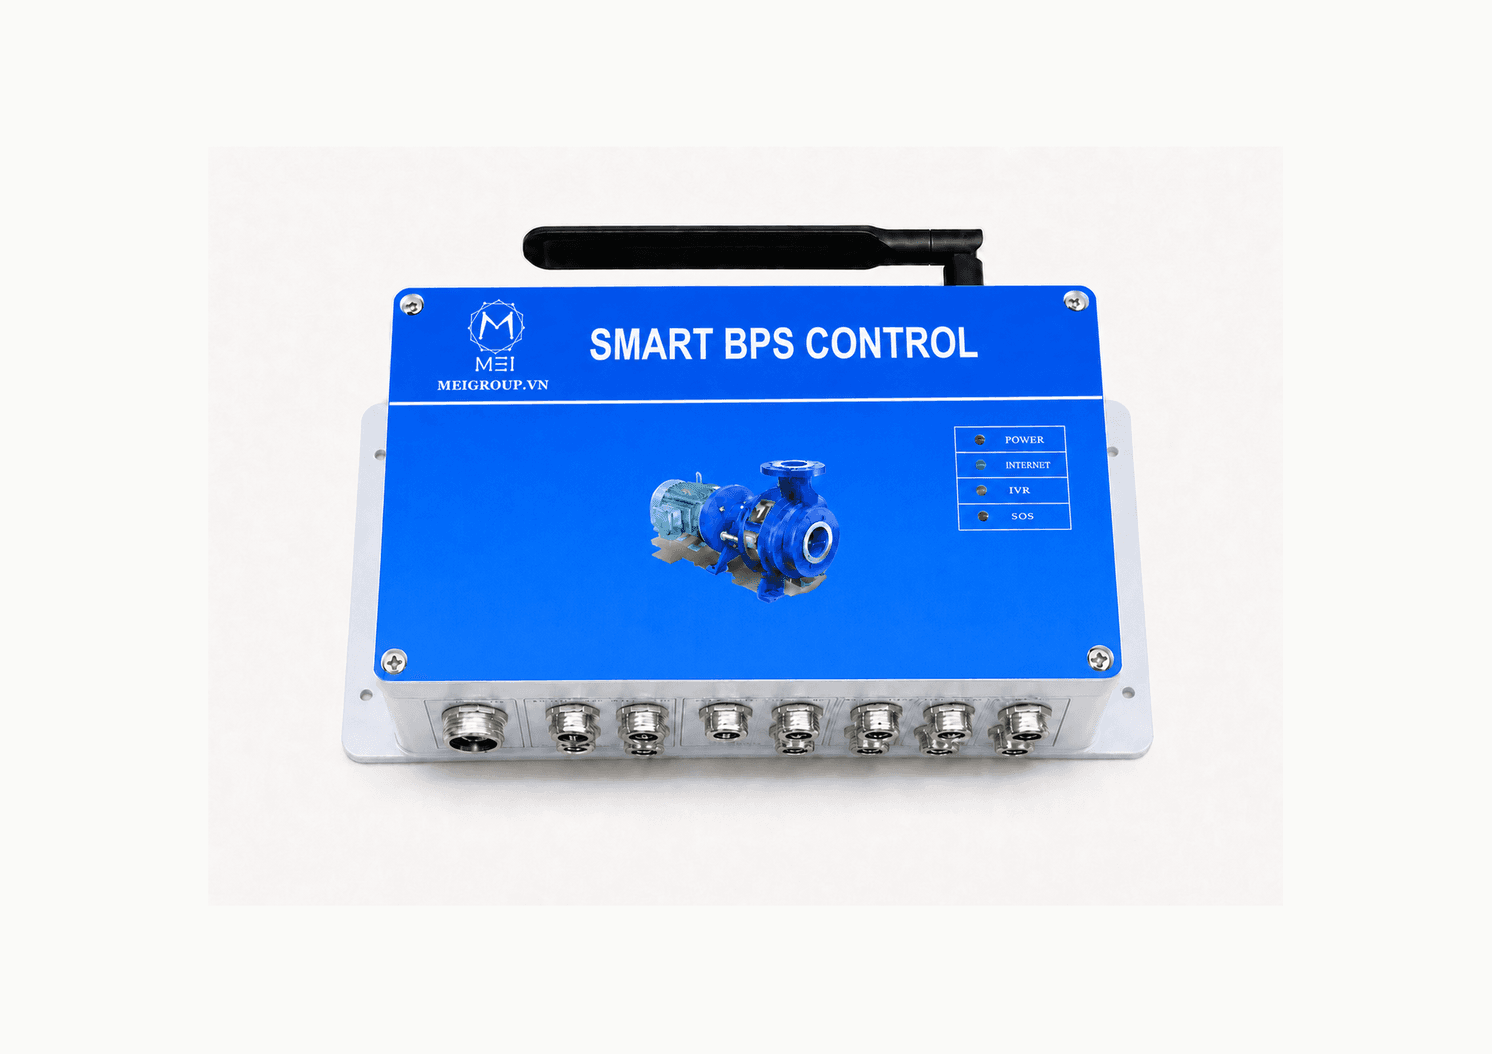
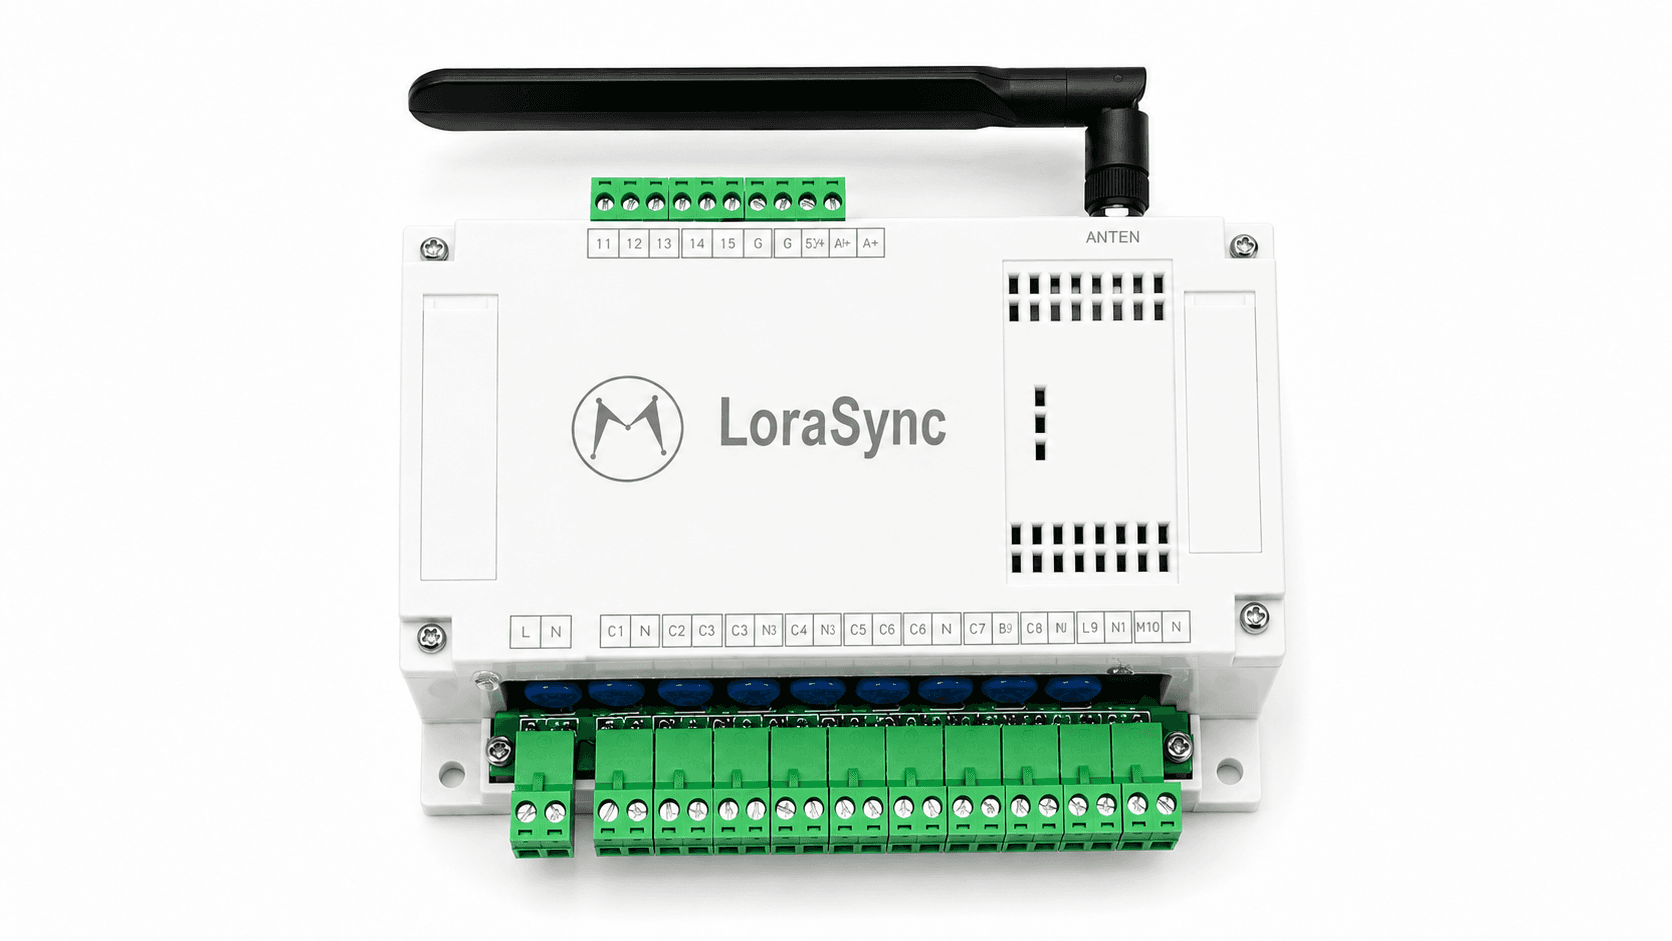
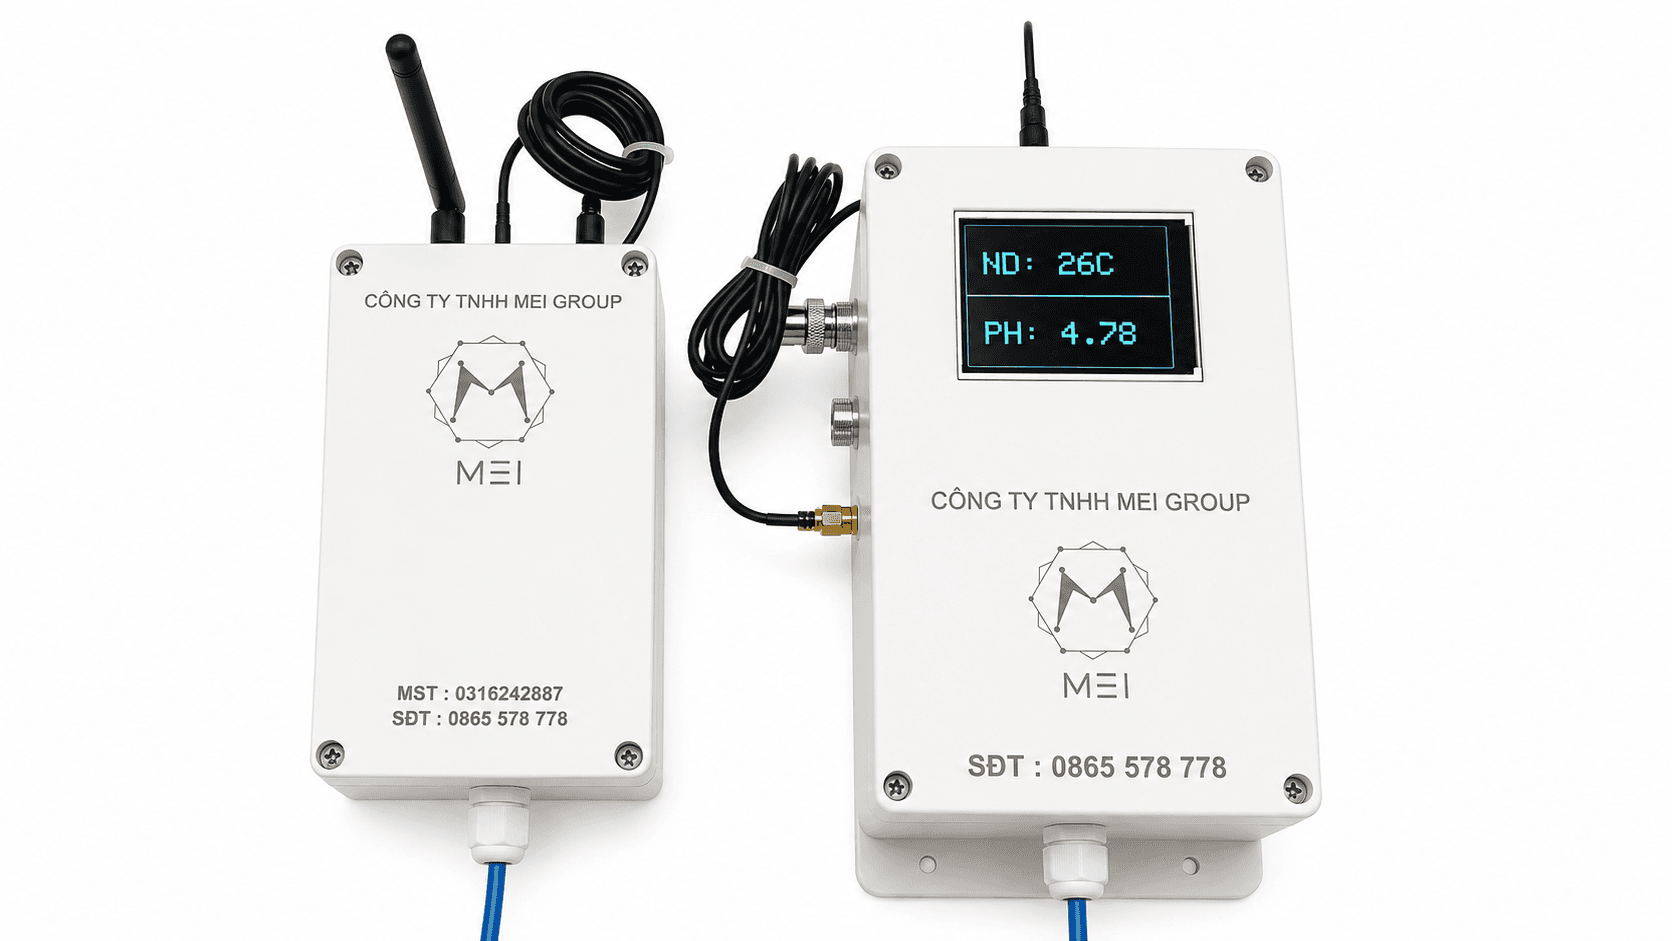
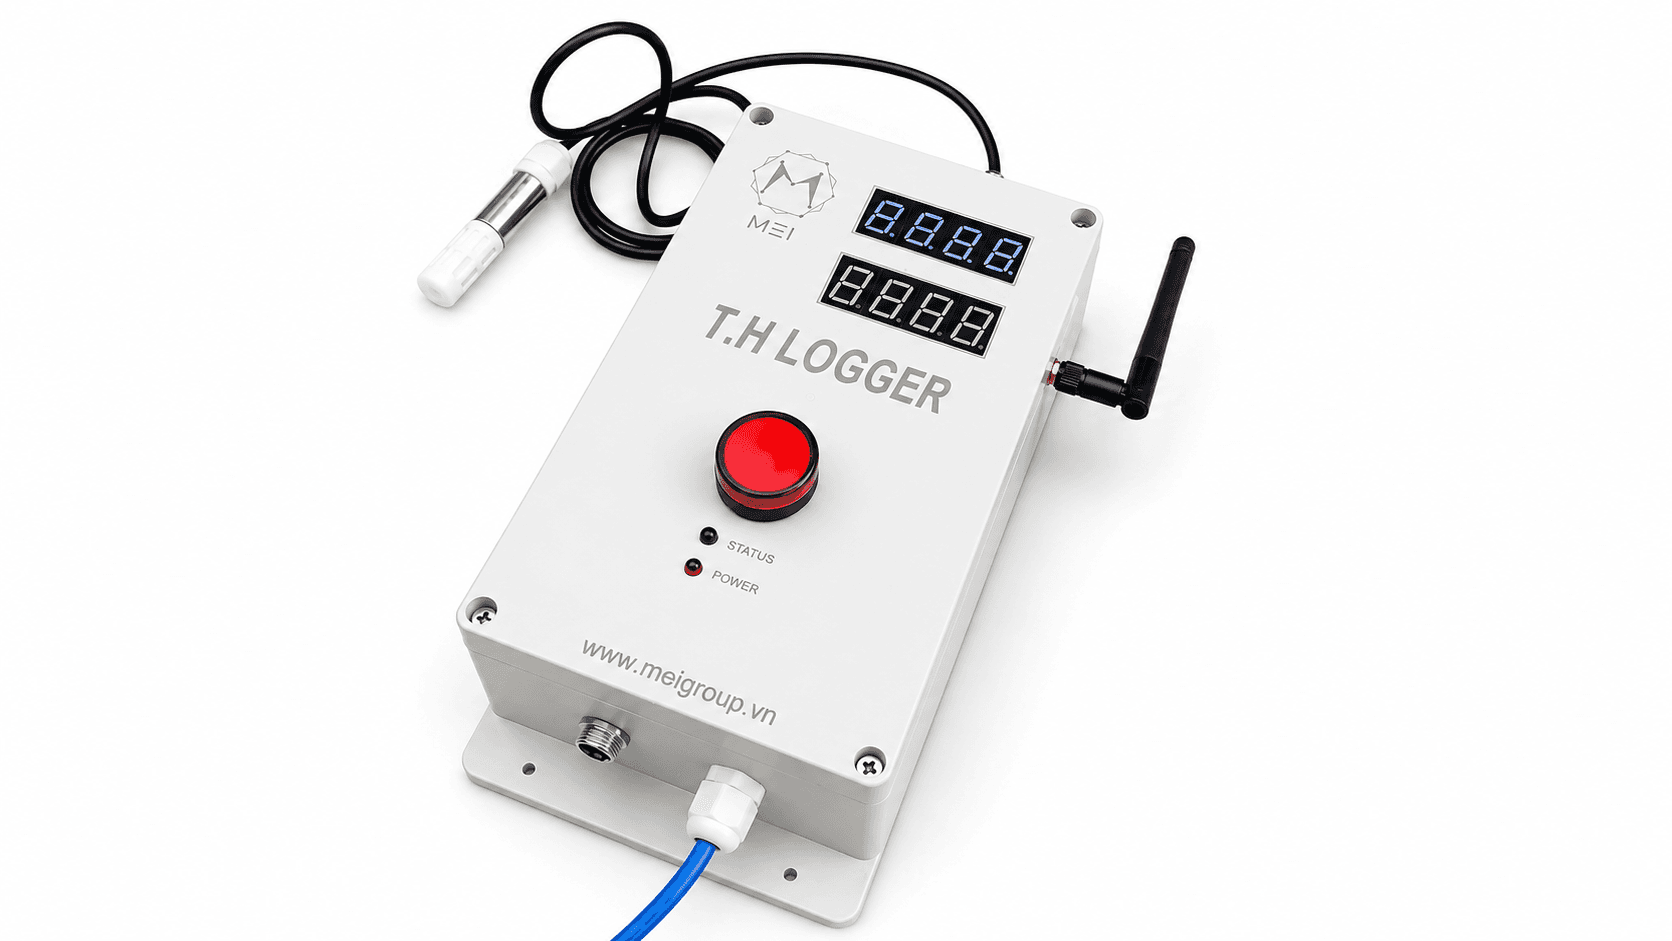
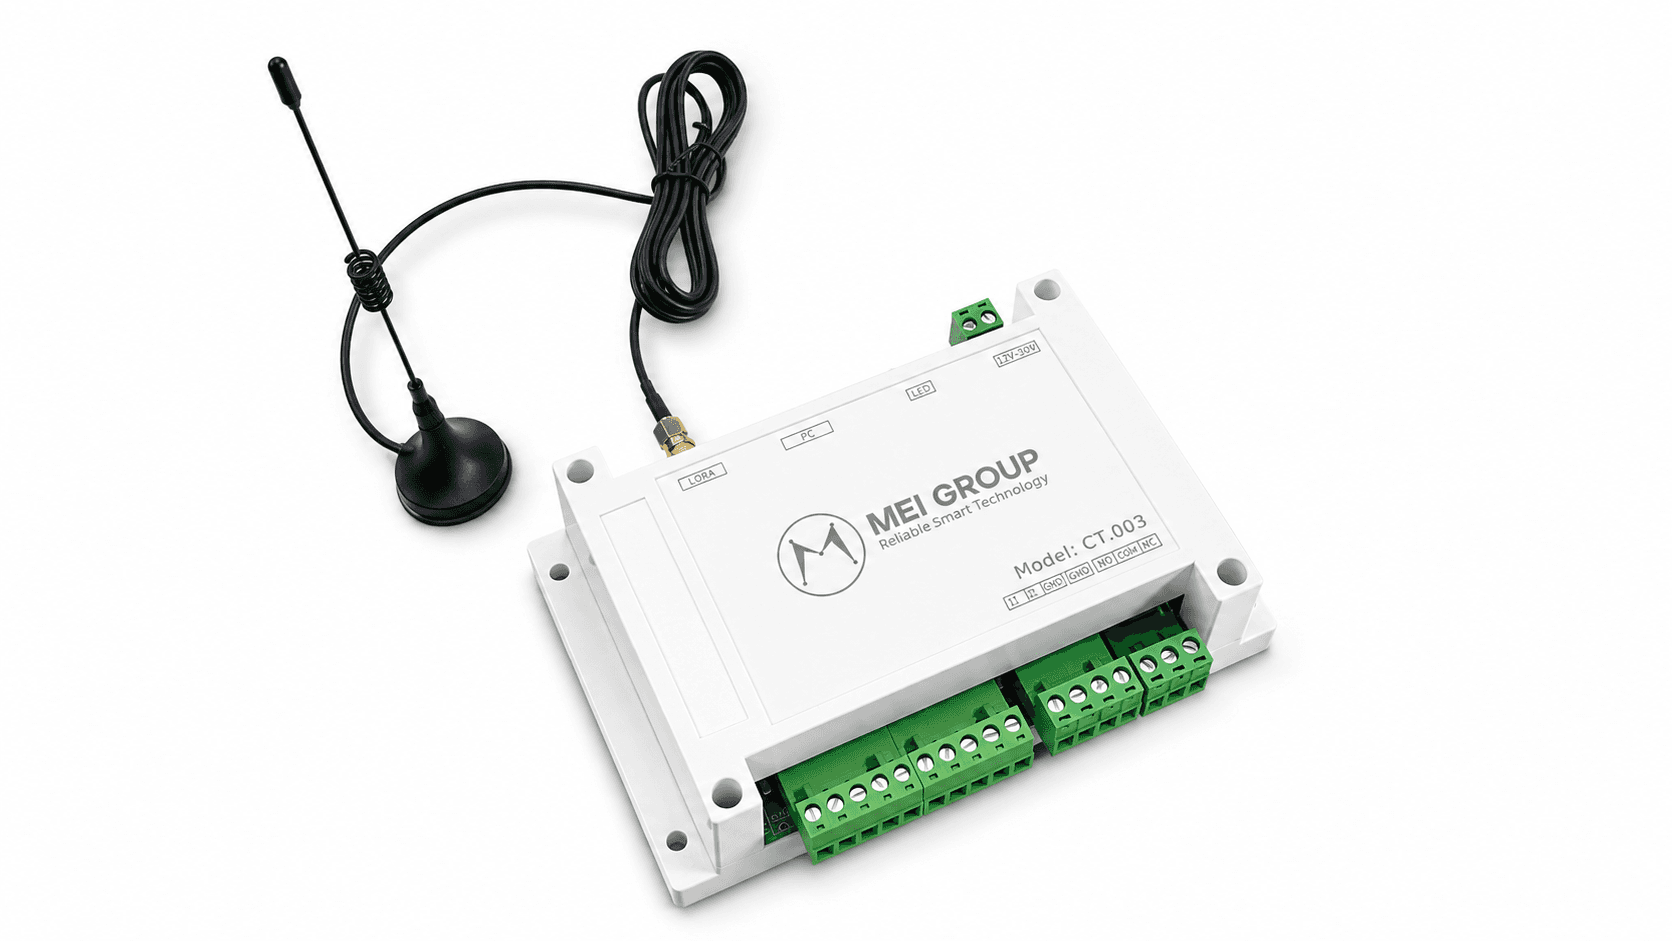
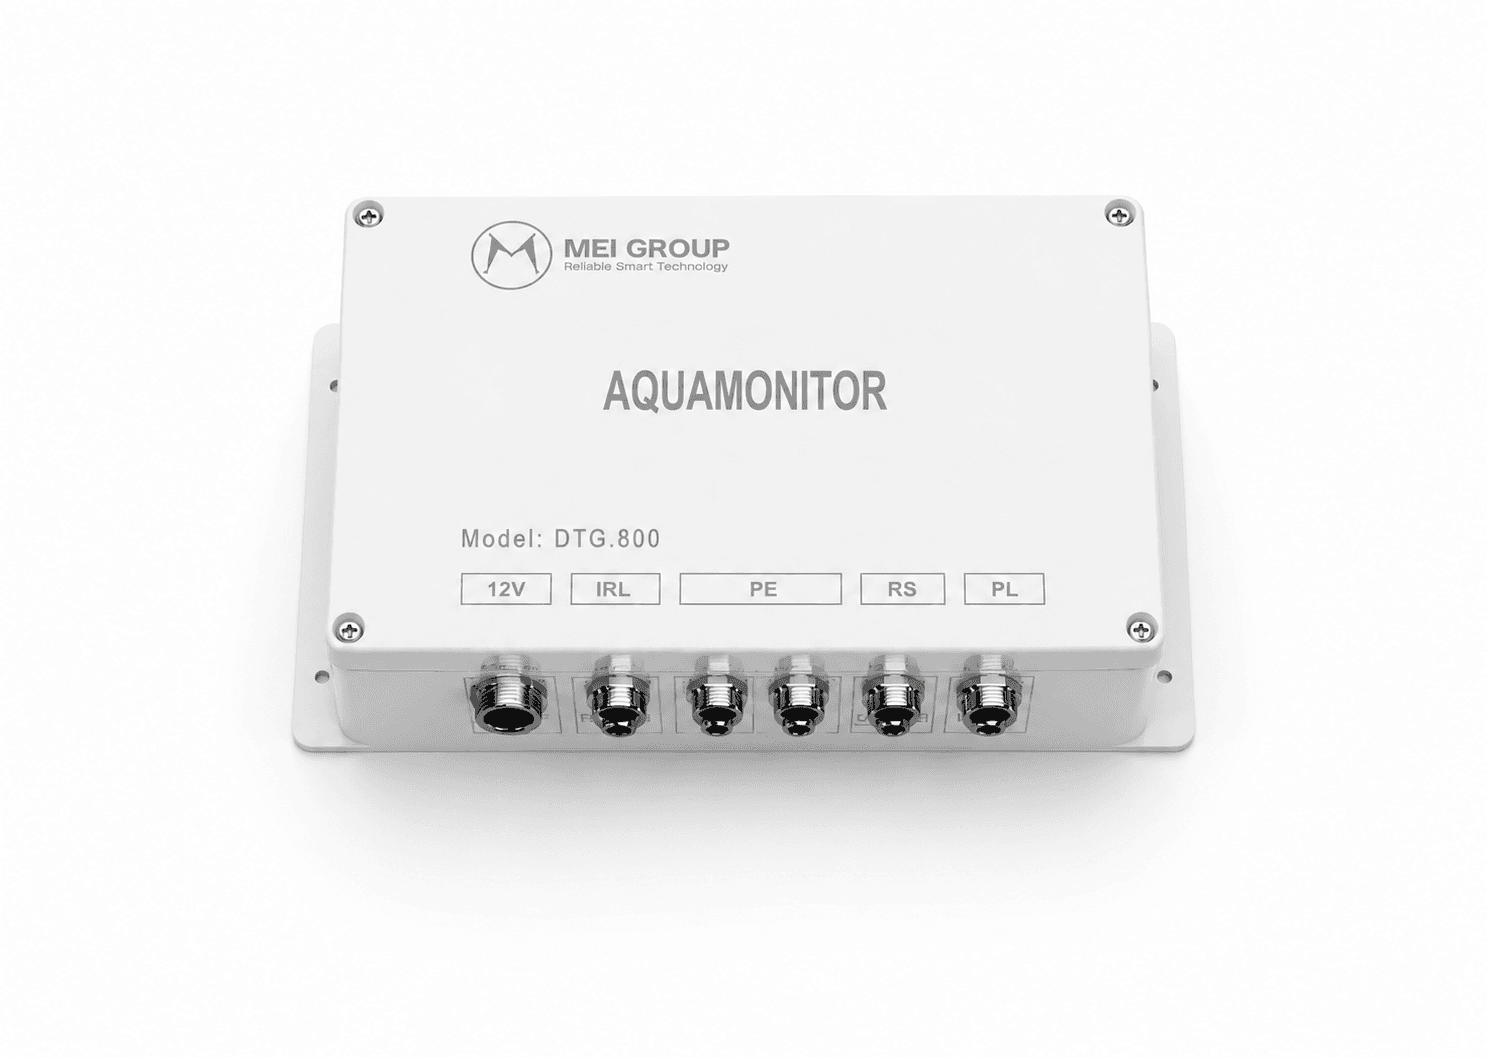
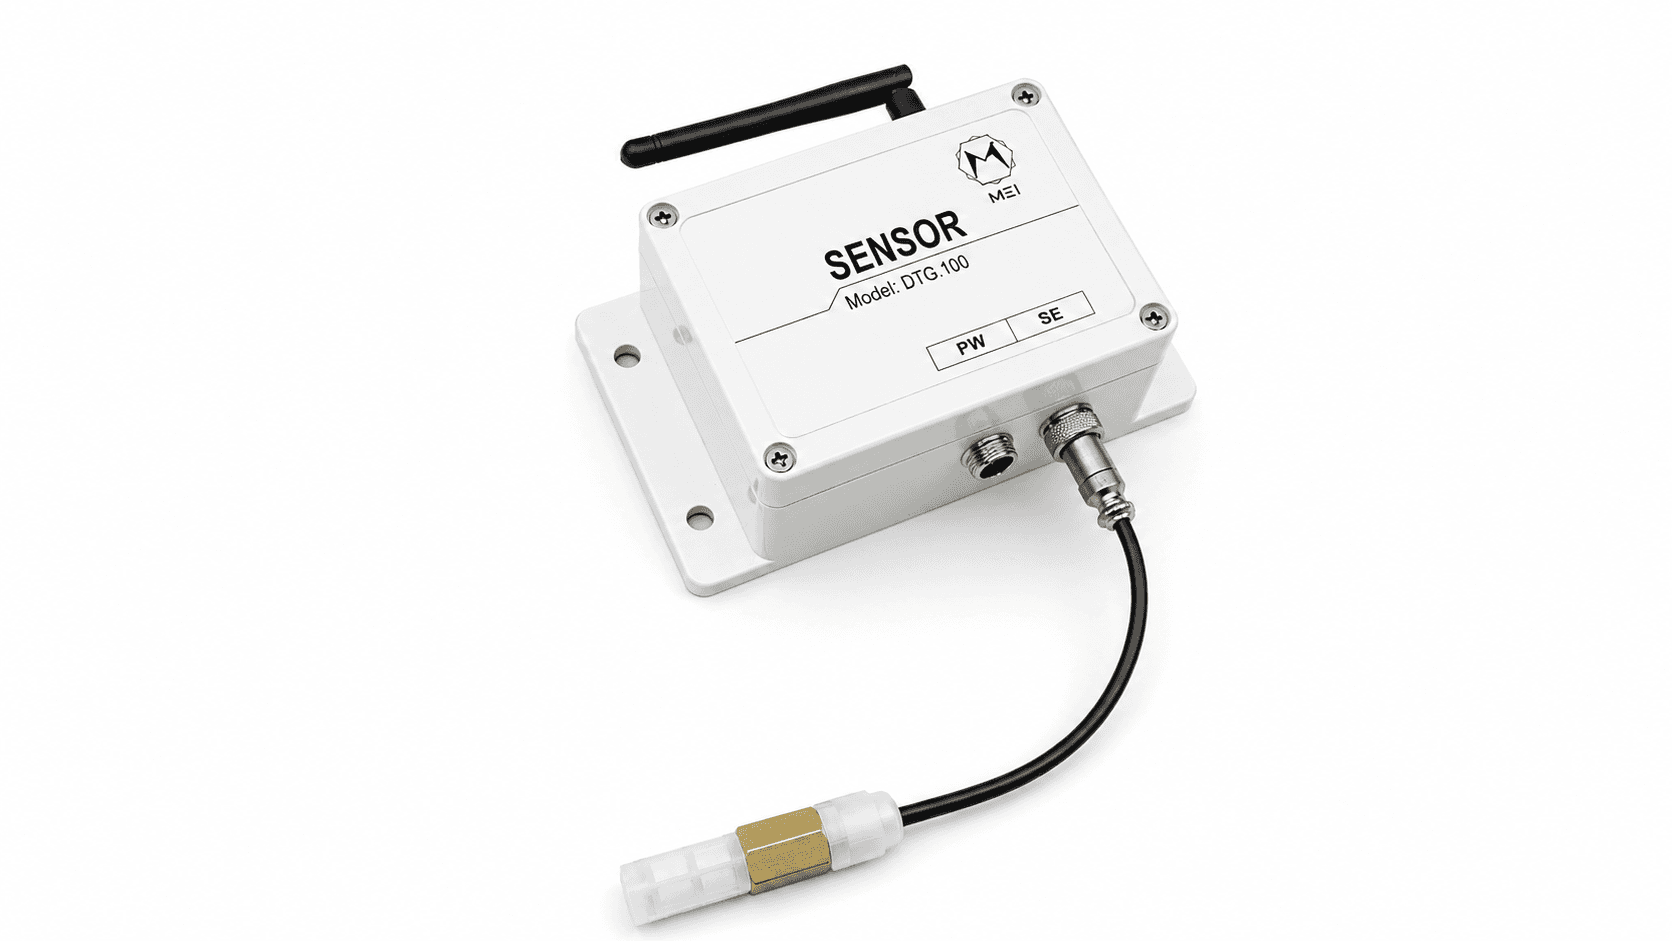
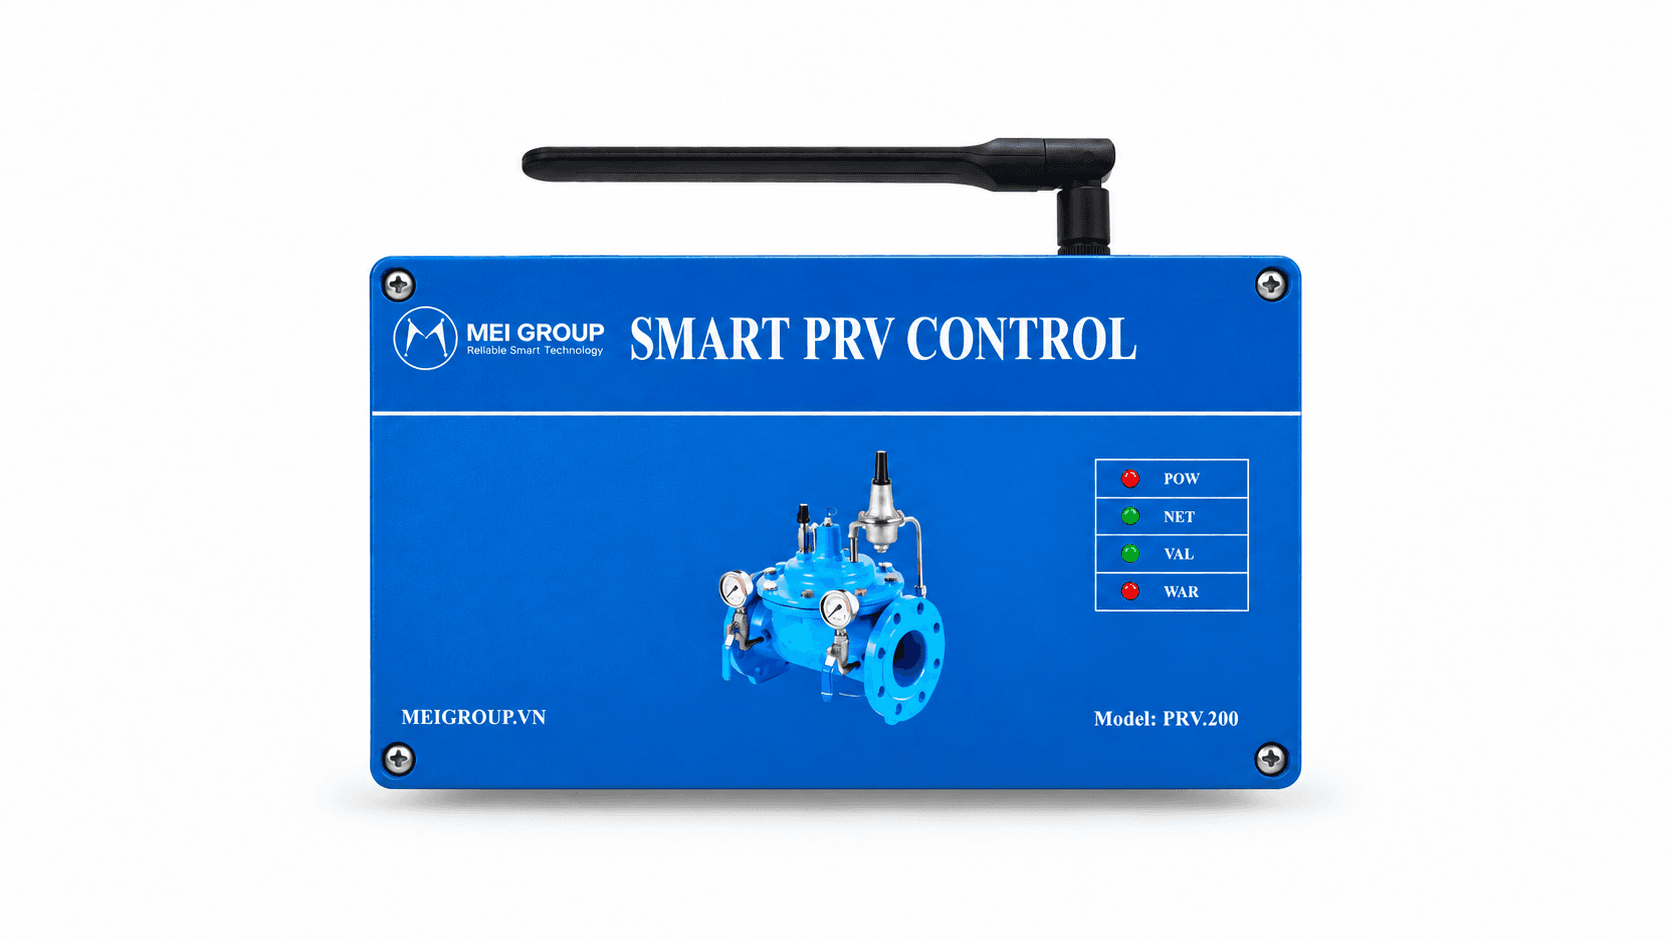
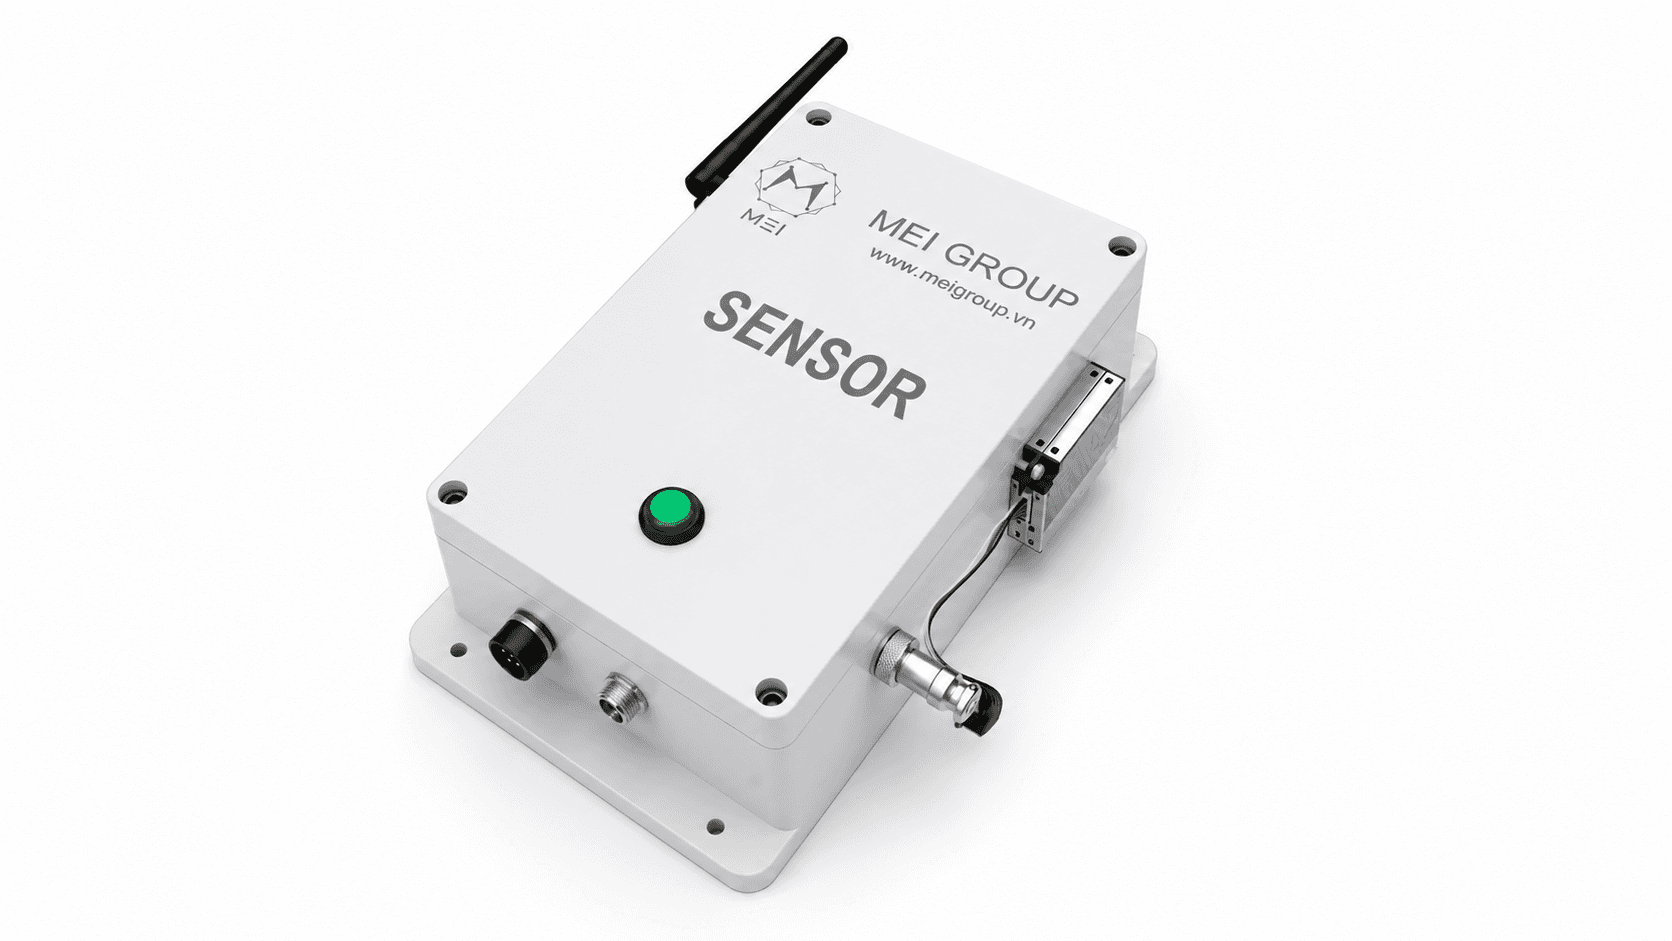
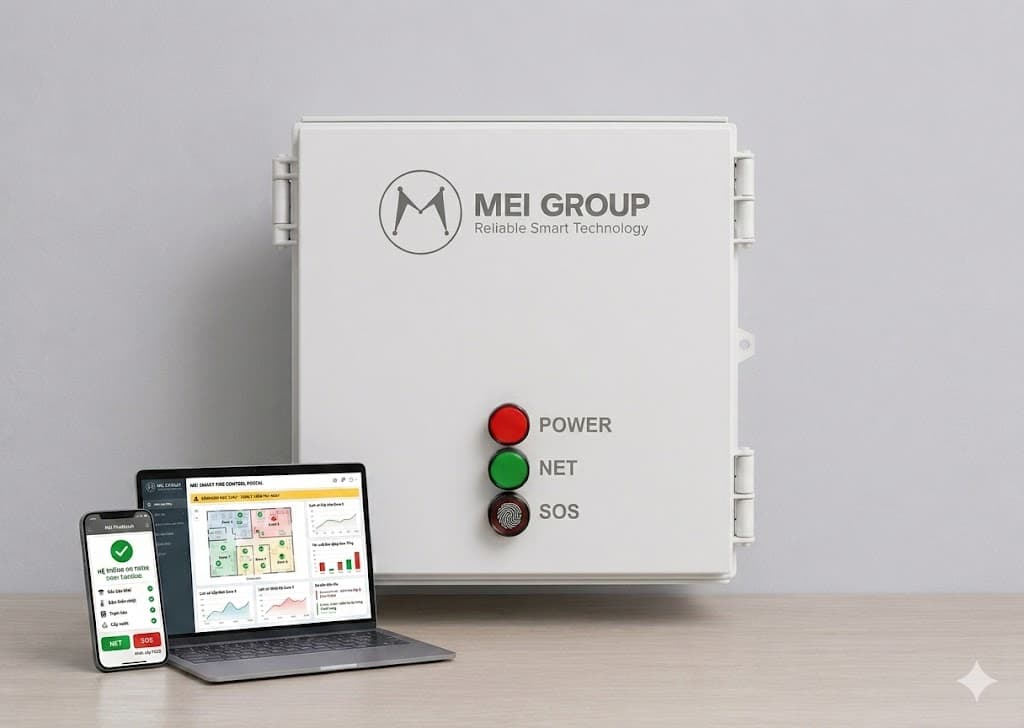
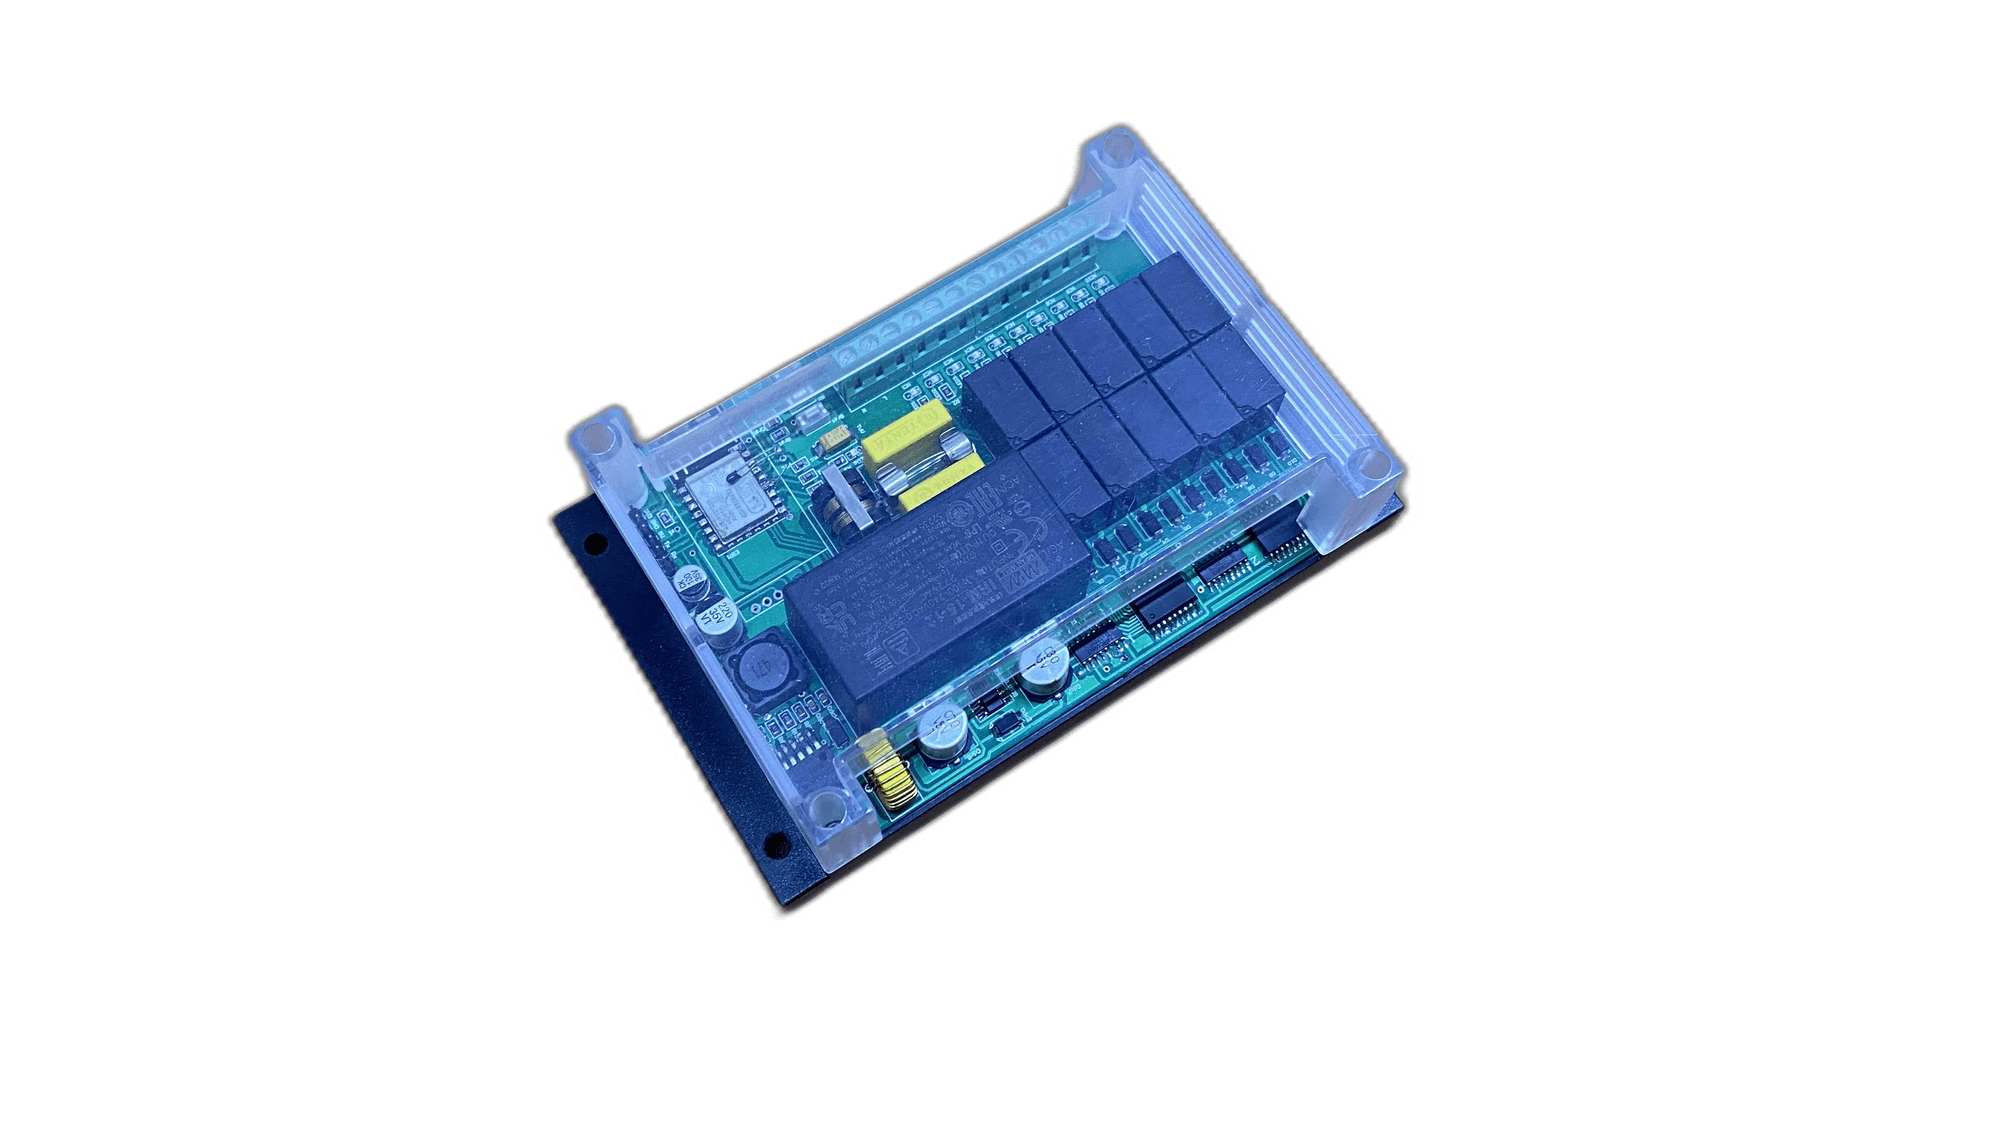
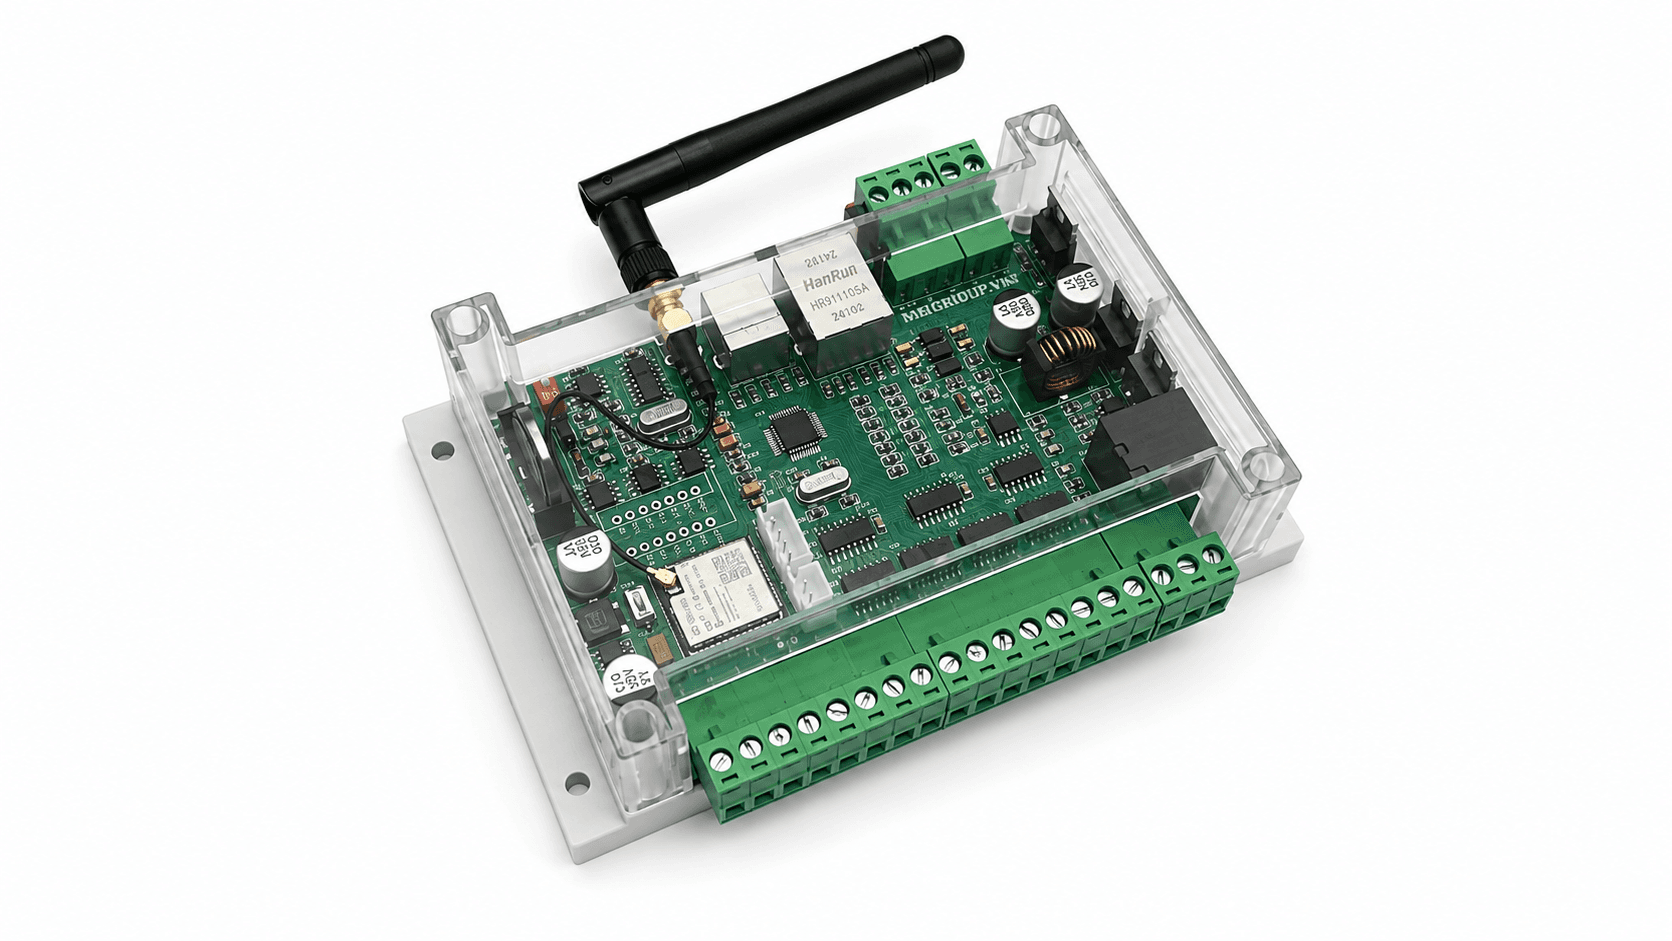
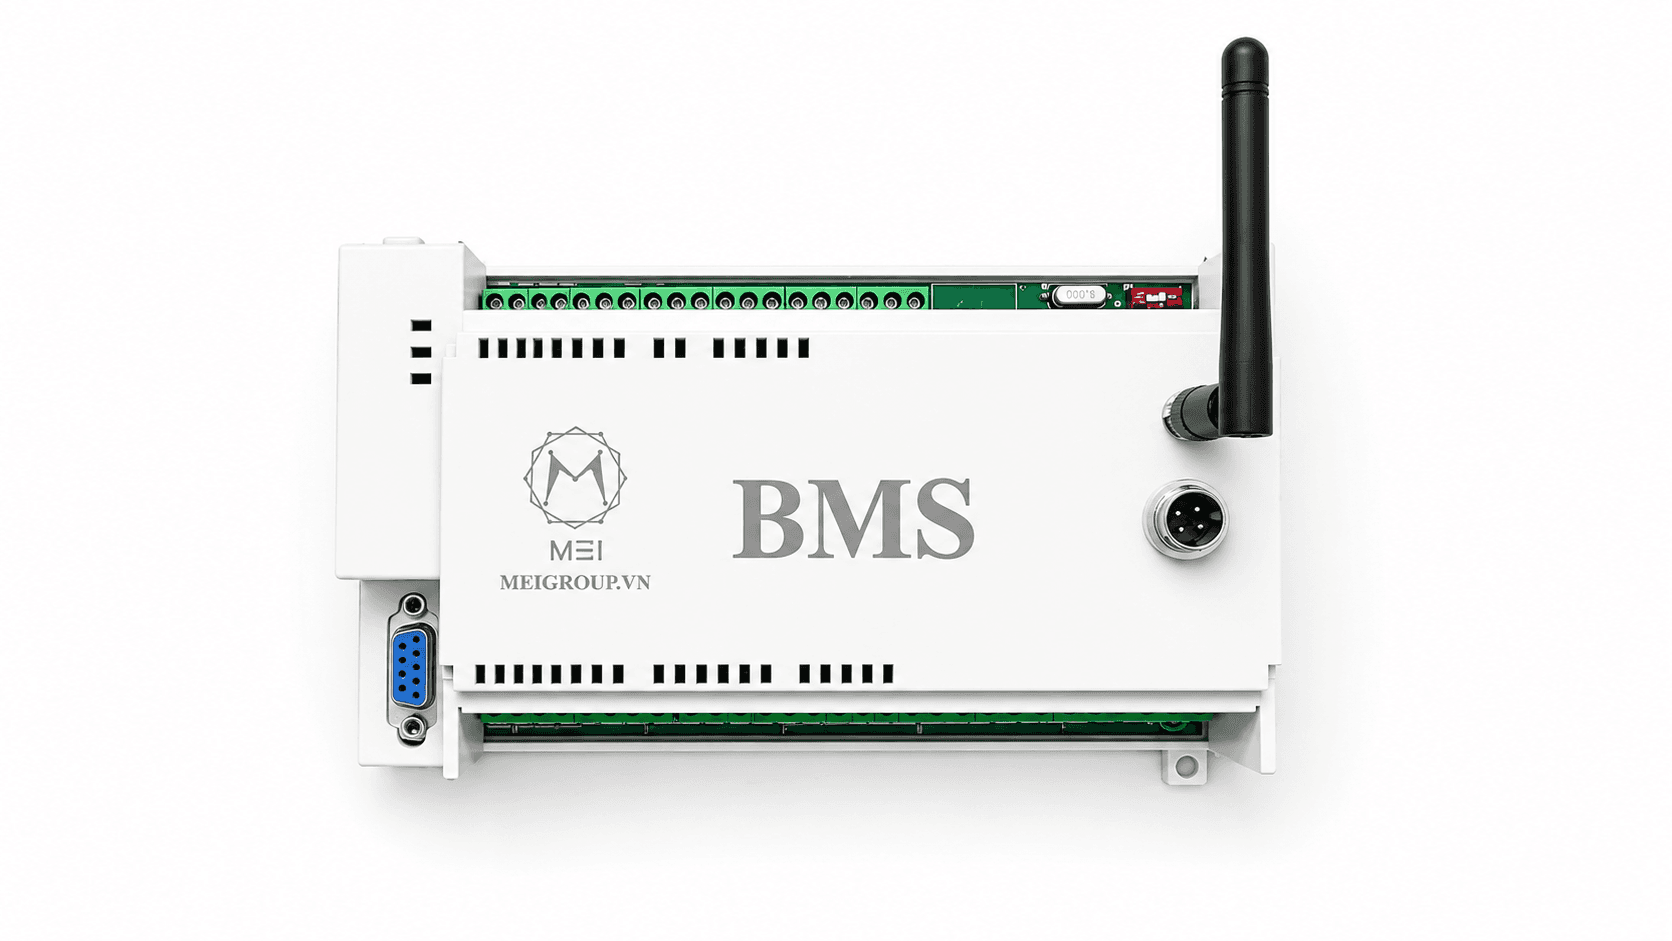
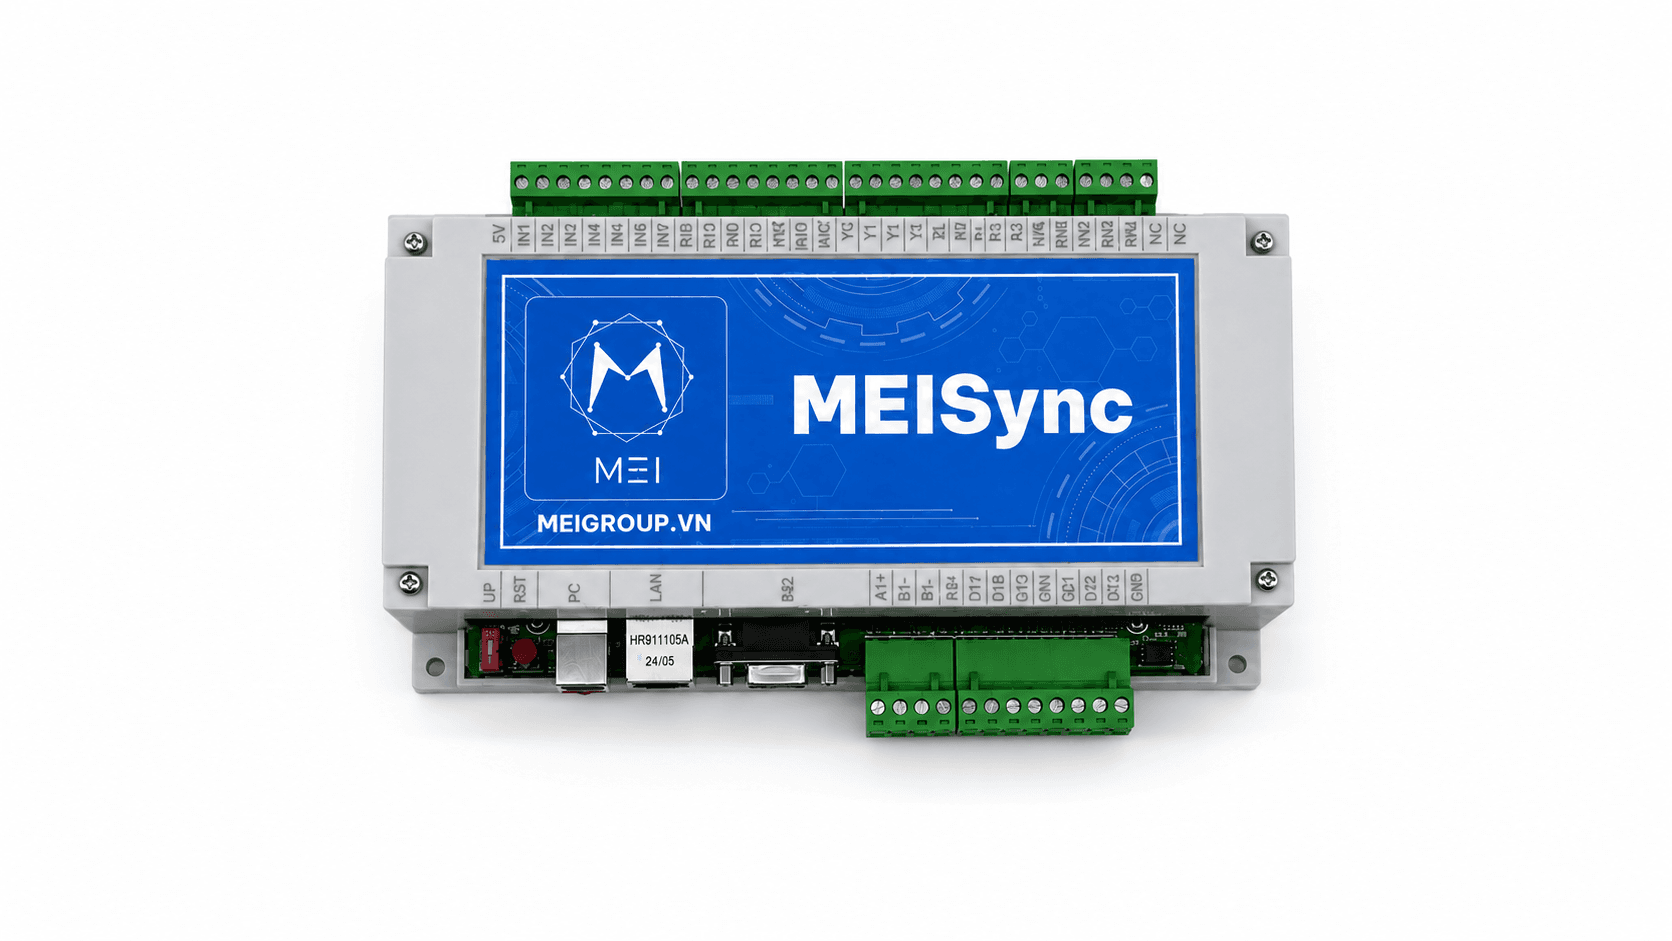
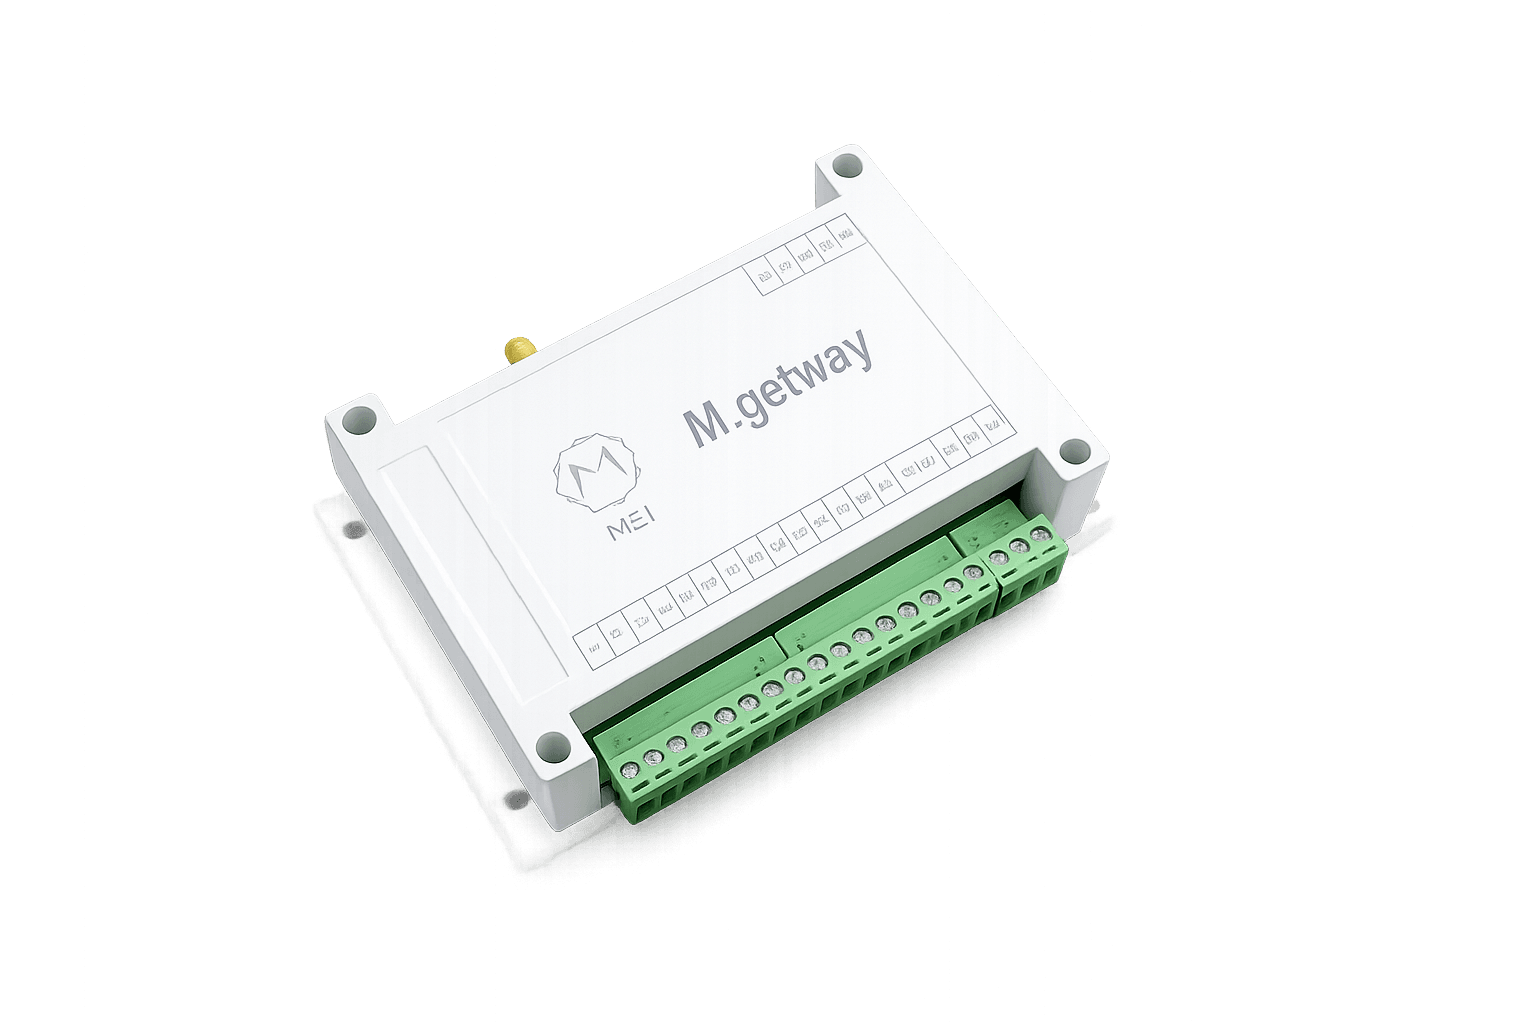
MEI pump performance analysis system allows to evaluate the relationship between flow (Q) and pressure/water column (H) during the actual operation of the pumping station. The device collects data from flow sensors (pulse, M-Bus, Modbus) and 4–20mA/LoRa pressure sensors, then automatically “counts samples”, filters noise and creates data groups that accurately reflect the pump characteristic curve according to each operating condition.
Automated construction system Q–H characteristic curve, displays the actual working point of the pump according to frequency or flow modes, helping to evaluate pump performance and deterioration over time. MEI ECO supports drawing curve graphs, multi-frequency graphs (30–50Hz), marking optimal performance points and displaying actual flow-pressure variation.
Users can export reports PDF/Excel/PNG, monitor pump performance history by day/week/month and receive warnings when the pump operates away from the optimal working area (off-curve), overloads or suddenly reduces pressure. The solution helps engineers optimize pump operation, save electricity and assess equipment status accurately in real time.
MEI system integrates modules Pump Curve Analysis to evaluate the relationship between flow (Q) and pressure/water column height (H) of the pump during actual operation. This is an important tool to determine pump performance, optimal working point and evaluate pump deterioration over time.
1. Collect and count data samples
MEI devices perform:
Note Q (flow rate) from flow sensor, M-Bus, Modbus or turbine pulse.
Note H (pressure) from a 4–20mA or LoRa sensor at the measurement point.
Sampling periodically: 1–5 seconds or by event.
Smart sample counter: automatically collects 5–10 points → creates 1 “instantaneous characteristic” data packet.
This accurately reflects the pumping curve according to the actual conditions of the pipeline.
2. Construction of pump curve (Pump Curve)
The system creates data sets:
MEI system supports:
3. Draw a pump curve plotting (Pump Curve Plotting)
MEI ECO automatically creates graphs:
Q–H chart curve shape
Displays multiple lines for frequencies: 30Hz – 40Hz – 50Hz
“Pump Efficiency Snapshot” view over time
Automatically mark the optimal working point (Best Efficiency Point – BEP)
Charts run in realtime or according to daily - weekly - monthly history.
4. Export reports & analysis
MEI ECO allows:
Export pump characteristic chart PDF, Excel, PNG
Automatic reporting:
Average operating point
Off-Curve run time (Off-Curve)
Signs of pump deterioration over time
Warning that the pump is overloaded or beyond the H max point
Suggestions for adjusting pressure setpoint or inverter frequency
5. Application
Evaluate pumping performance at water supply stations
Pump aging monitoring
Optimize electricity saving
Analyze DMA/DMZ operations
Support engineers to place pumps - choose the right pump for the actual load